Area groupings and findings
Area groupings
In order to describe the climatology of an area, stations that display similar trends have been grouped together. Thus for stations that include the base period, the groupings are: English East Coast (stations 3 - 10), Thames region (stations 12 - 16), Eastern Channel (stations 18 - 22), Western Channel (stations 23-24) and Eastern Irish Sea (stations 34 - 38). Figures 3 - 7 show the annual temperature anomaly from the base period (1971 - 2000) for 1970 - 2004. A trend line has been included from 1985 to 2004 to show the trend in temperature in the last 20 years.
Despite the number of stations included here, there is a significant spatial gap in the South West coastal region. There is no climatic grouping for the remainder of the Irish Sea because there are an insufficient number of stations that run for the base period of 1971 - 2000.
Comparisons have also been made between the temperatures recorded from the ferry route (Position 2) and the most appropriate inshore temperature network station (Figure 8).
Table 2 presents the annual temperature anomalies for selected stations for 1994 - 2004 from the base period (1971 - 2000), colour coded by the range in temperature.
For all 9 sampling positions from the ferry route, Table 3 presents annual salinity anomalies for 1994 - 2004 from the base period (1971 - 2000), colour coded by the range in salinity.
Findings
This data set has quantified the inter-annual variability in the near coastal temperatures in the seas around the UK. The evidence is that the long-term change is distinguishable from the inter-annual variability.
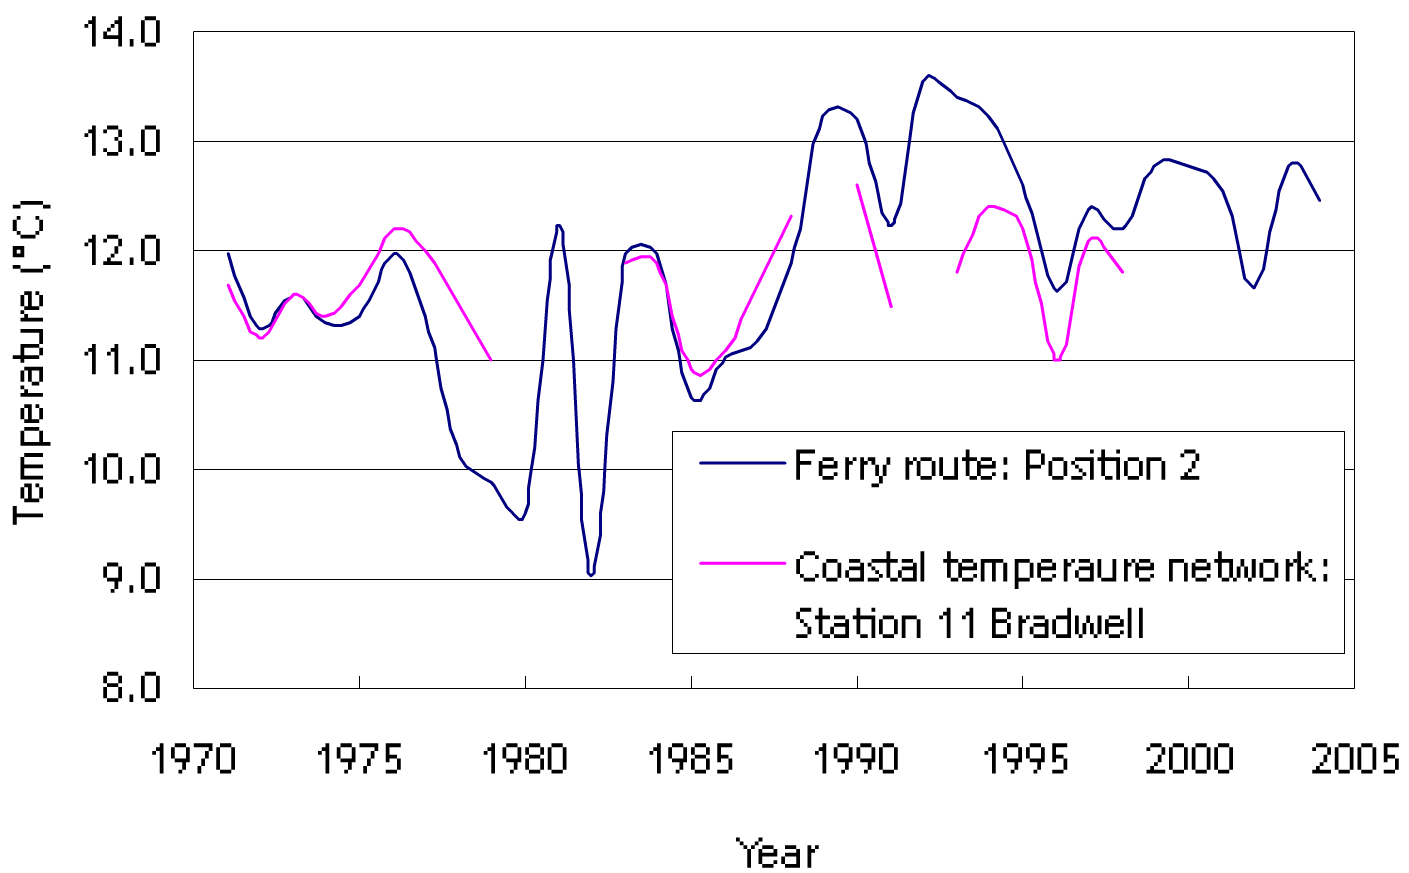
Figure 3: East Coast area
All of the coastal sea areas show an overall increase in temperature during the last 20 years (Figures 3 - 7). Combining a group of twenty coastal stations which have similar statistical characteristics, the average temperature rise in inshore waters is 0.3°C per decade since 1966 but with a greater rate of warming (0.5 to 0.75°C) in the last 20 years.
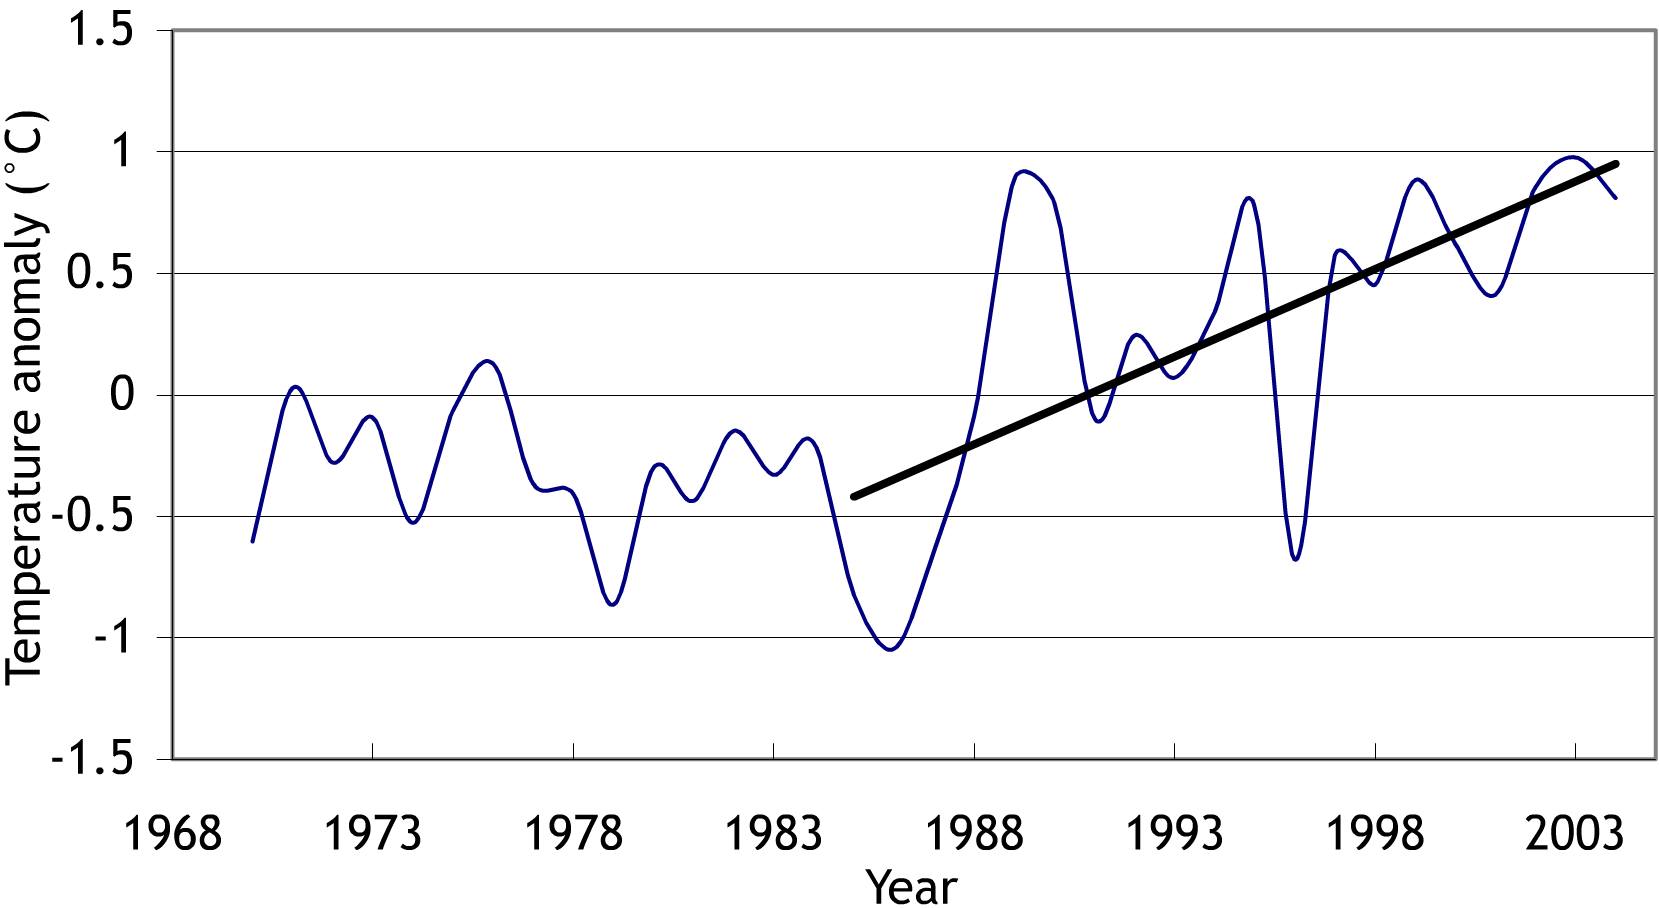
Figure 4: Thames region
In Figures 3, 4 and 7, for the East coast, the Thames and the Irish Sea, 1979, 1986 and 1996 show colder periods with 1986 and 1996 showing the most abrupt changes. The Eastern and Western Channel areas (Figure 5 and 6) show the same trend apart from experiencing a more abrupt colder period in 1991 than in 1996. Although the very cold year of 1979 was most pronounced in the Irish Sea, in other regions, the western channel, eastern channel and Thames region, this cold period extended for three years from 1978 - 1980. The extremely cold period in 1986 was evident in all of the sea regions.
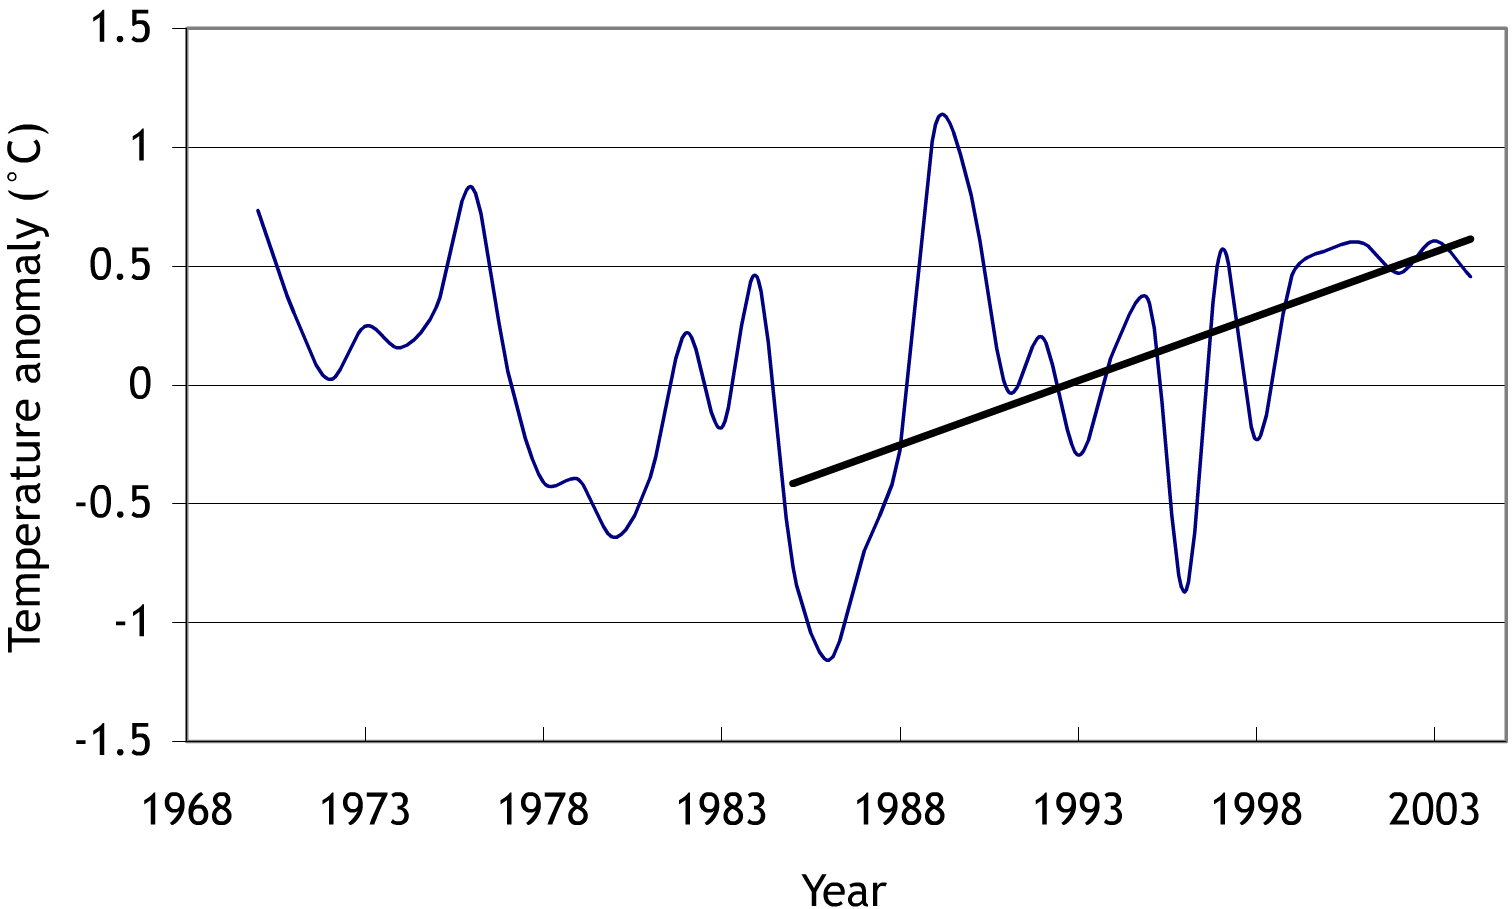
Figure 5: Eastern Channel area
Following this, was a dramatic shift in all sea areas (1988 - 1990), with a sharp rise in temperature leading to two very warm years of 1989 and 1990 with continued temperature rise since that time, with all areas showing similar trends. Previous to this warm period, a short warming period occurred, starting in 1973 and reaching a maximum in 1976. It was most pronounced in the western Channel but was also evident in the other regions.
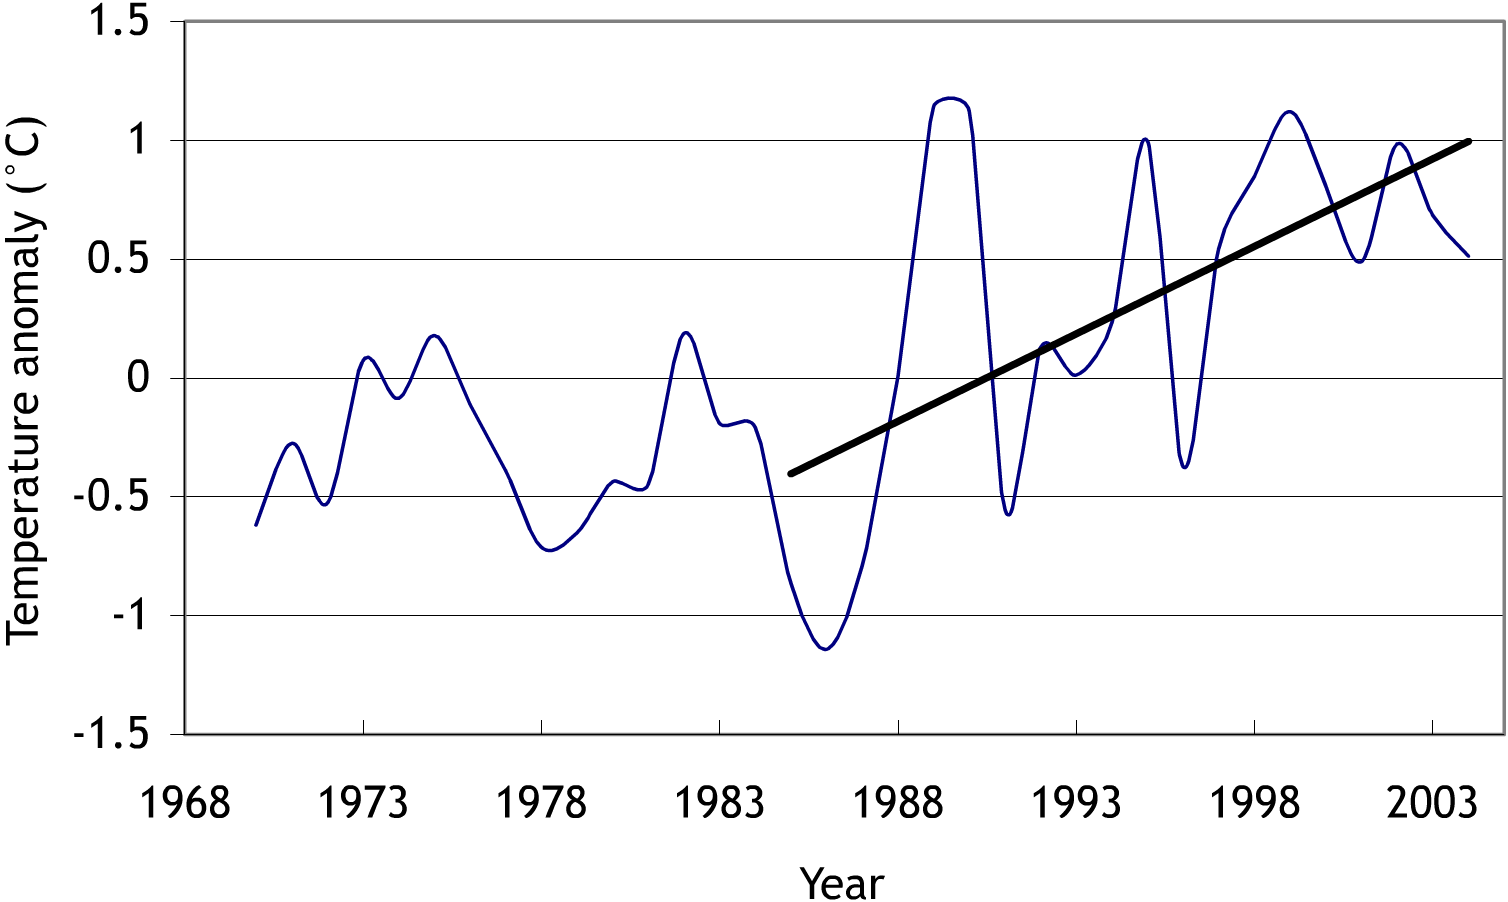
Figure 6: Western Channel area
The stations offshore in the Southern Bight show an overall increase in temperature from 1971 to present (Figure c: P2, P4 and P7). The high temperatures of 1990 are also evident in all the coastal regions, while the 1982 peak was only evident in the English Channel region. The high temperatures in 2002 and 2003 are not evident in any of the other regions.
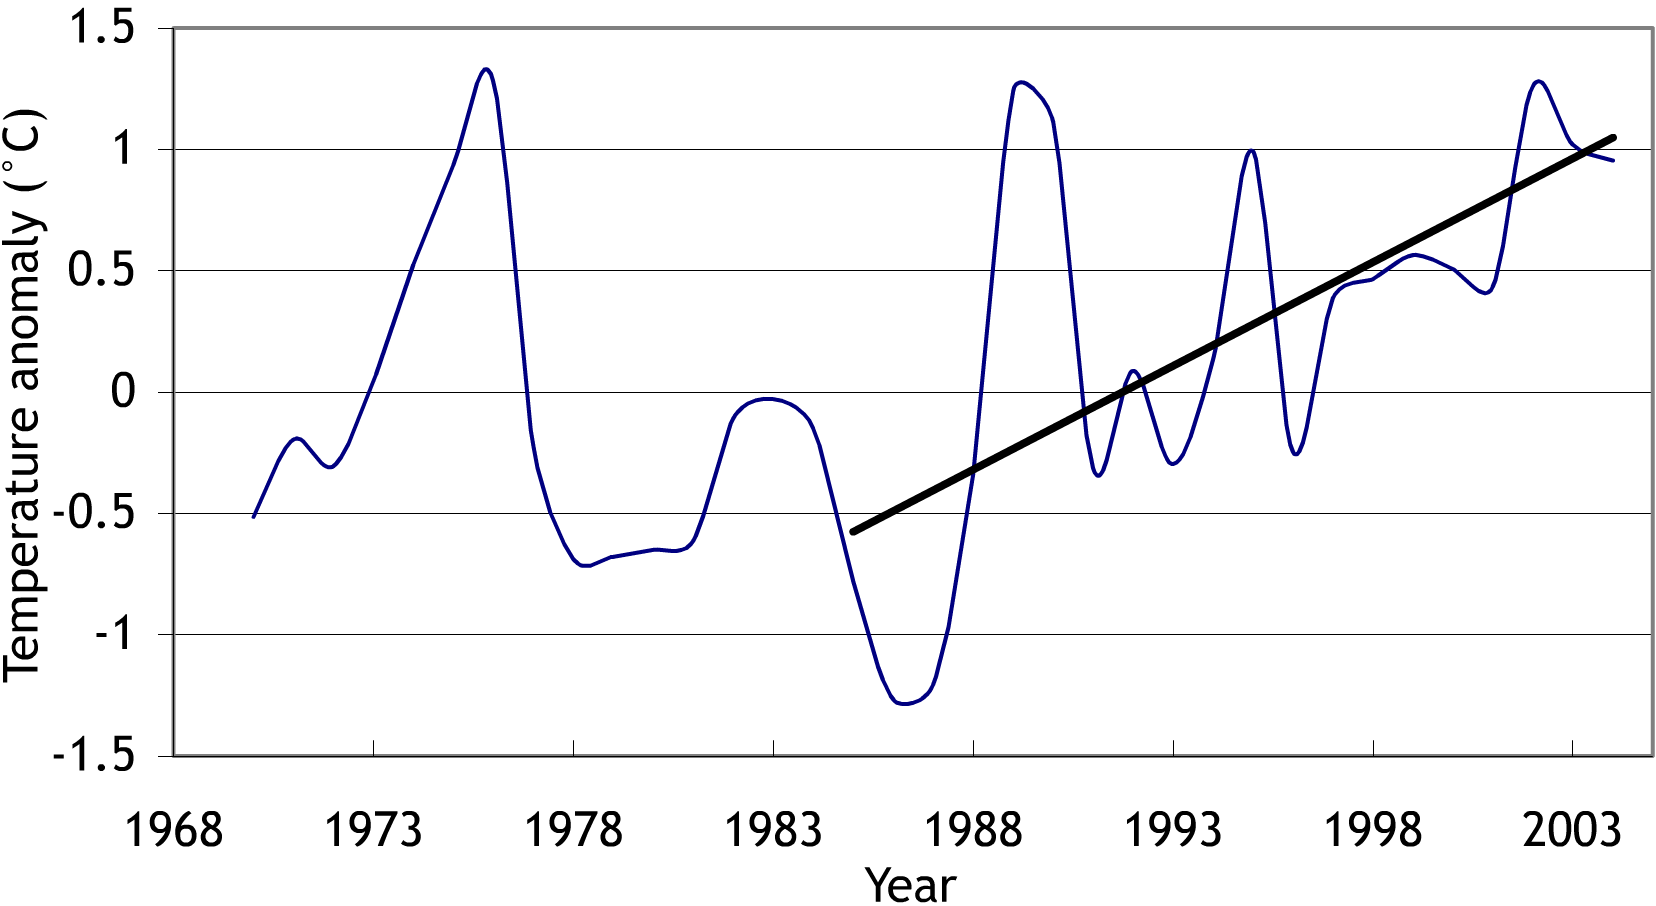
Figure 7: Irish Sea area
The seasonal cycle of salinity is evident from Figure b, positions 2, 4 and 7. The lowest salinity is consistent across the transect, occurring in May to June, but with greater variability in the time of maximum salinity, usually in the winter months. Variability in all the salinity records is high but especially large in the summer months. It is postulated that this variability is dominated by flow through from the English channel (Dickson et al., 2003).
In most areas of the North Sea low salinities were observed in 1994, 1995, 2001 and 2002 and returning to near normal values in 2004, after a period of very high salinity that persisted in 1997 and 1998. This trend is clear in the salinity time-series figures for Position 2, Position 4 and Position 7 (Figures a, b and c) and Positions 1 - 9 (Table 3).
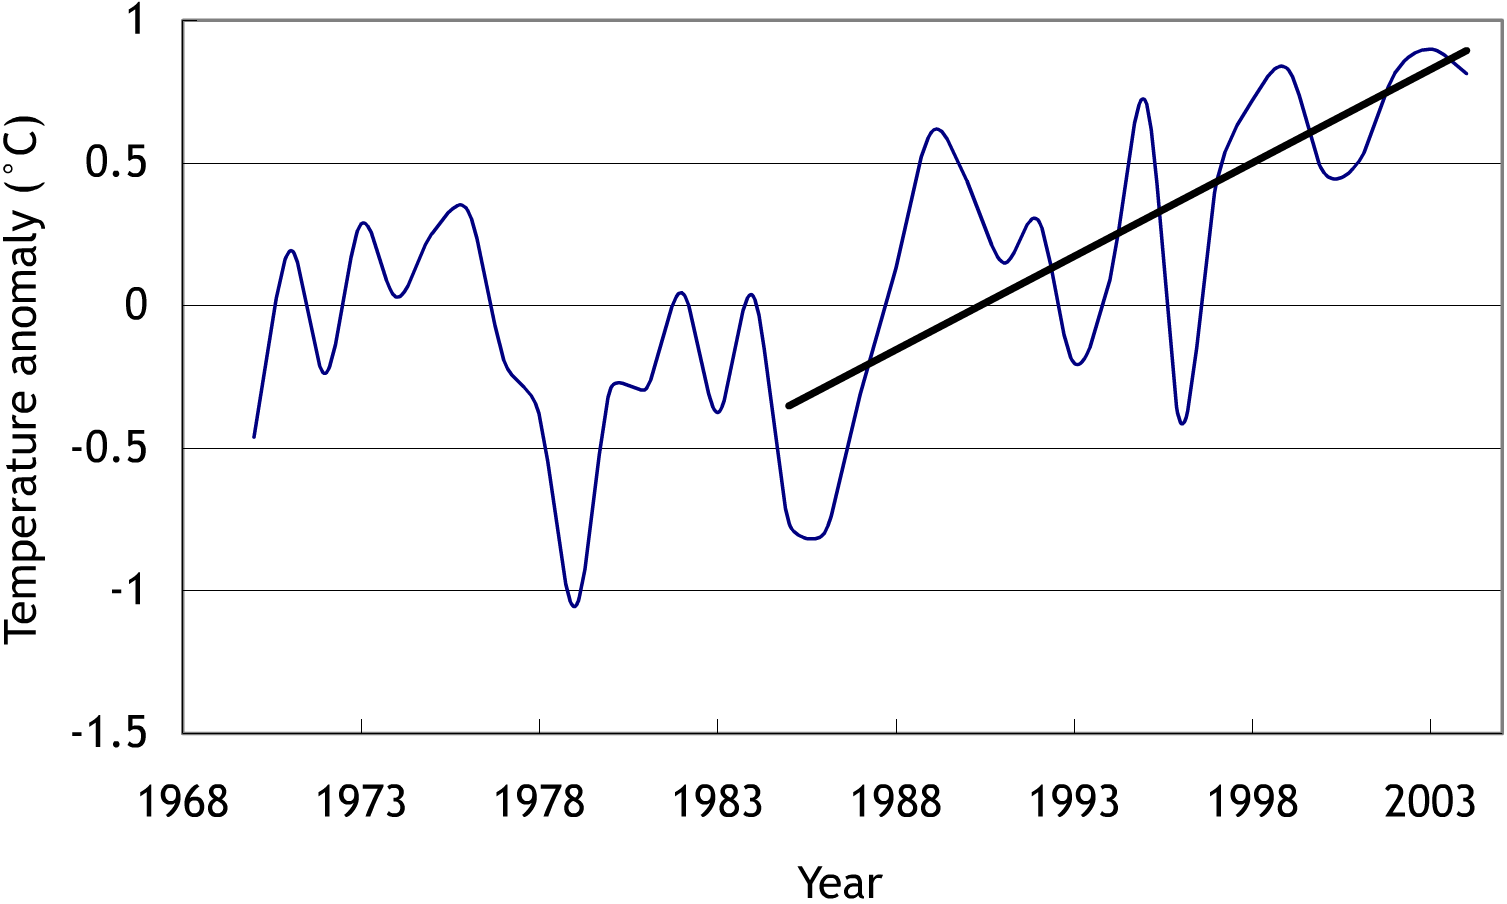
Figure 8: Comparison between ferry route position 2 and coastal temperature station Bradwell