Ferry route data
Position 2
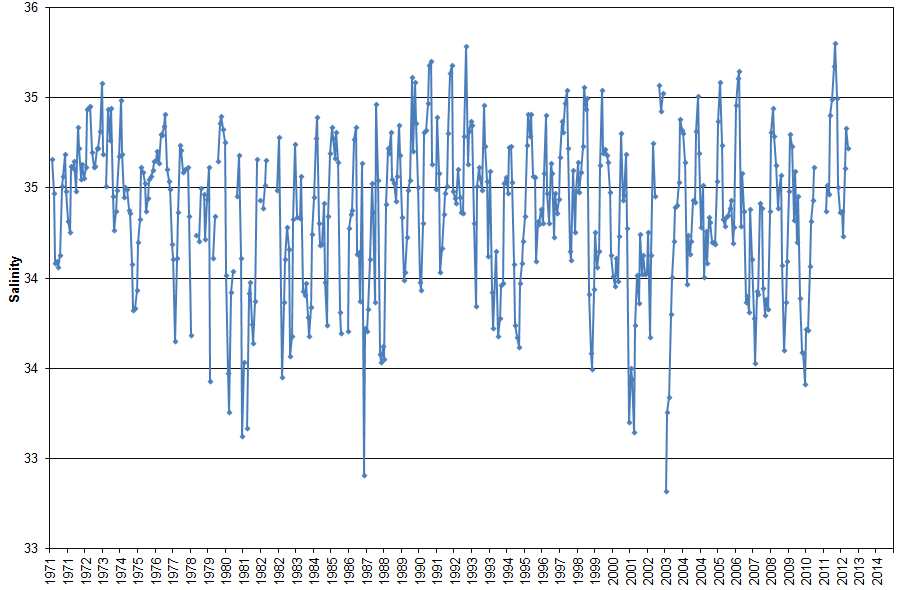
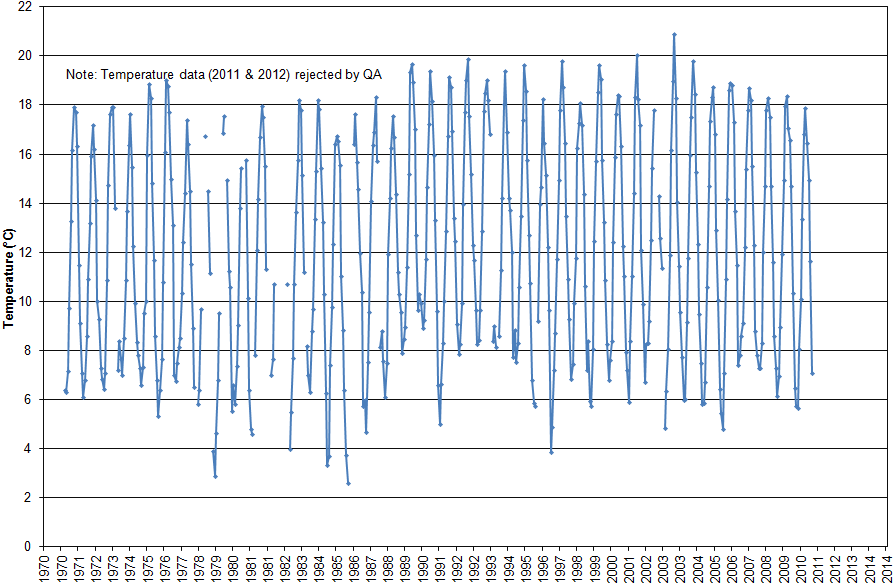
Figure 'a': Monthly mean surface temperature and salinity for the entire duration of the record at the station which are derived from simple averaging of all the monthly data.
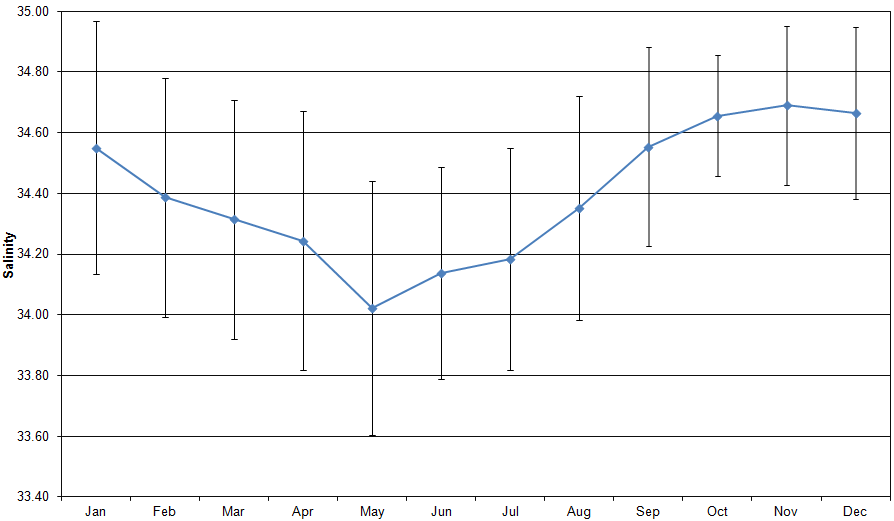
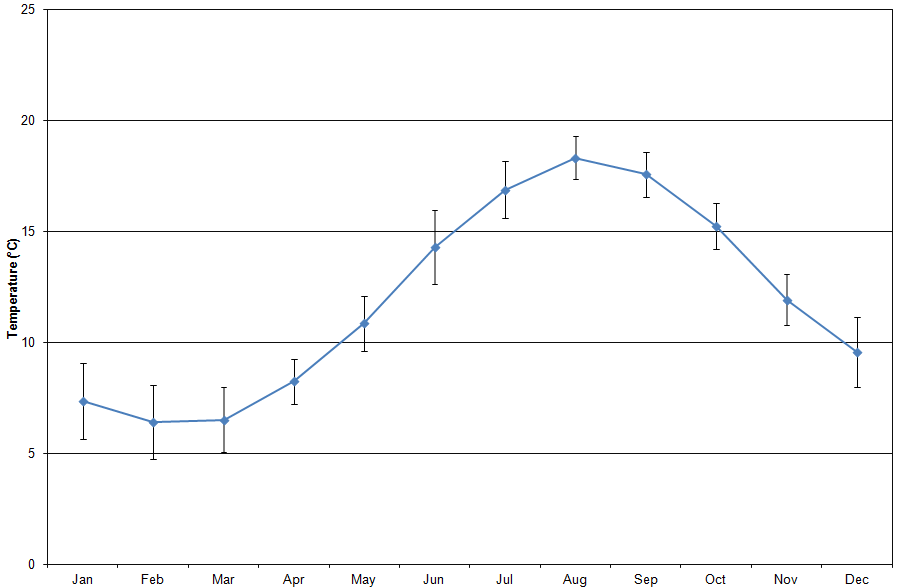
Figure 'b': Monthly climatic average with the first standard deviation. The standard deviation has been derived from the difference in the monthly average from the long-term mean (1971 - 2000).
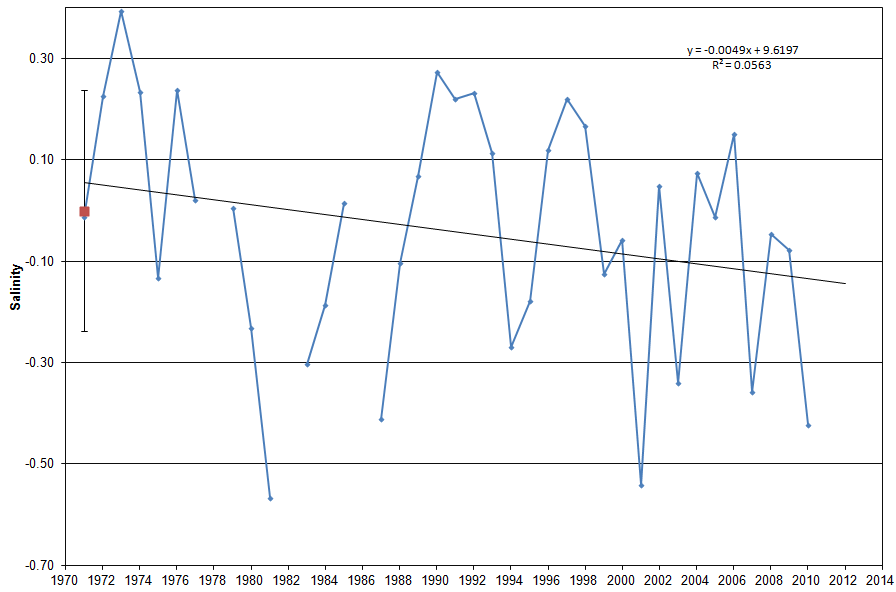
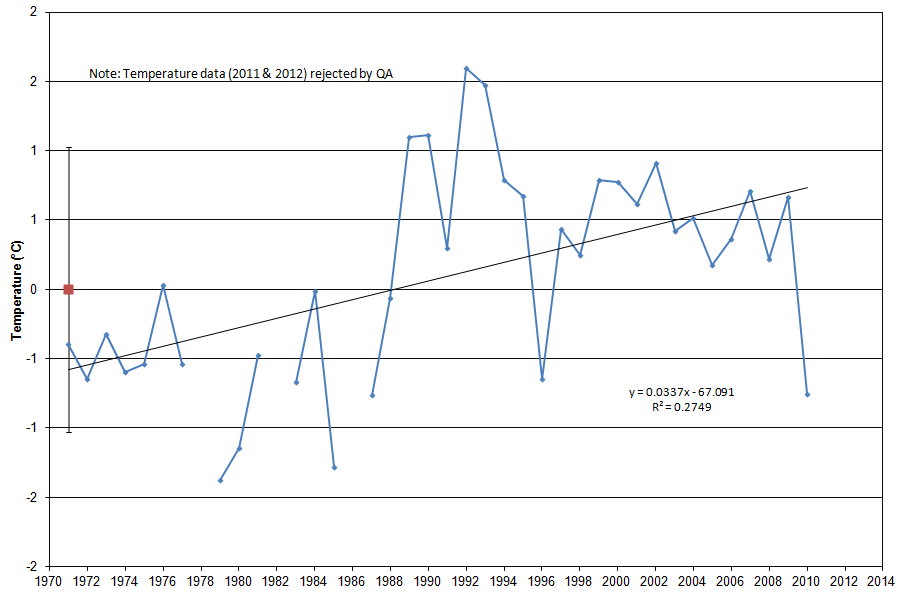
Figure 'c': Yearly anomaly from the base period. Where the average base period (1971 - 2000) has been subtracted from the average annual temperature and salinity. The standard deviation of the annually averaged temperature and salinity of the entire record is also shown. A trend line derived from a linear least squares analysis has been added to indicate the extent to which annual changes are linear.