Station 26
Newlyn
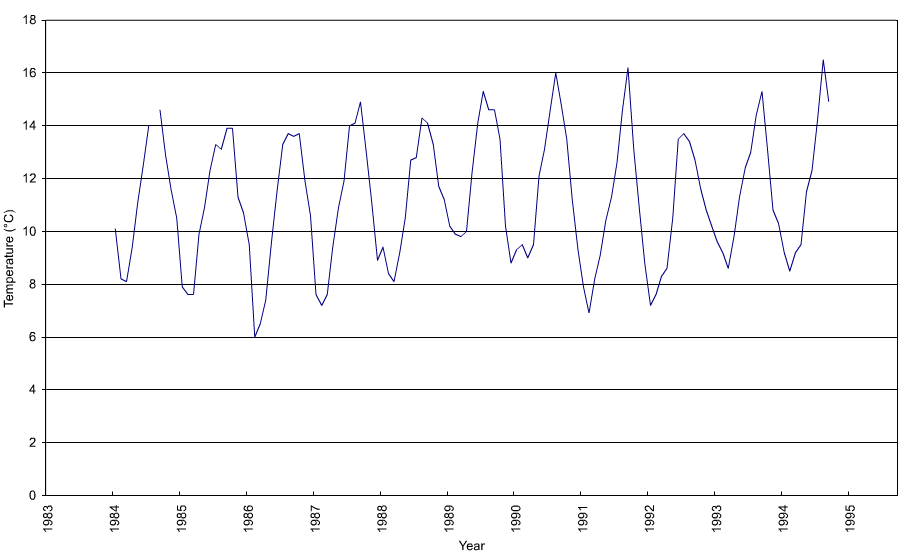
Figure 'a': Monthly mean surface temperature for the entire duration of the record at the station which are derived from simple averaging of all the monthly data.
Monthly Mean Sea Temperature for NEWLYN at 50° 6' N, 5° 32' W
| Year | Jan | Feb | Mar | Apr | May | Jun | Jul | Aug | Sep | Oct | Nov | Dec |
|---|---|---|---|---|---|---|---|---|---|---|---|---|
| 1984 | 10.1 | 8.2 | 8.1 | 9.4 | 11.1 | 12.5 | 14.0 | 14.6 | 12.9 | 11.6 | 10.5 | |
| 1985 | 7.9 | 7.6 | 7.6 | 9.9 | 10.9 | 12.3 | 13.3 | 13.1 | 13.9 | 13.9 | 11.3 | 10.7 |
| 1986 | 9.5 | 6.0 | 6.5 | 7.4 | 9.6 | 11.5 | 13.3 | 13.7 | 13.6 | 13.7 | 11.9 | 10.6 |
| 1987 | 7.6 | 7.2 | 7.6 | 9.4 | 10.9 | 11.9 | 14.0 | 14.1 | 14.9 | 13.0 | 11.1 | 8.9 |
| 1988 | 9.4 | 8.4 | 8.1 | 9.2 | 10.5 | 12.7 | 12.8 | 14.3 | 14.1 | 13.3 | 11.7 | 11.2 |
| 1989 | 10.2 | 9.9 | 9.8 | 10.0 | 12.2 | 14.1 | 15.3 | 14.6 | 14.6 | 13.5 | 10.2 | 8.8 |
| 1990 | 9.3 | 9.5 | 9.0 | 9.5 | 12.1 | 13.1 | 14.6 | 16.0 | 14.8 | 13.5 | 11.2 | 9.3 |
| 1991 | 7.9 | 6.9 | 8.2 | 9.1 | 10.4 | 11.3 | 12.6 | 14.6 | 16.2 | 13.1 | 10.9 | 8.8 |
| 1992 | 7.2 | 7.6 | 8.3 | 8.6 | 10.5 | 13.5 | 13.7 | 13.4 | 12.7 | 11.6 | 10.8 | 10.2 |
| 1993 | 9.6 | 9.2 | 8.6 | 9.8 | 11.3 | 12.4 | 13.0 | 14.4 | 15.3 | 13.1 | 10.8 | 10.3 |
| 1994 | 9.2 | 8.5 | 9.2 | 9.5 | 11.5 | 12.3 | 14.2 | 16.5 | 14.9 | |||
| 2010 | 15.4 | 14.6 | 12.4 | 8.7 | ||||||||
| 2011 | 9.0 | 9.0 | 9.6 | 11.8 | 12.8 | 13.5 | 15.0 | 15.8 | 15.1 | 14.4 | 13.2 | |
| 2012 | 10.0 | 10.5 | 10.7 | 15.6 | 16.4 | 15.4 | 14.2 | 12.4 | 10.7 | |||
| mean | 8.9 | 8.3 | 8.5 | 9.6 | 11.1 | 12.6 | 14.0 | 14.7 | 14.7 | 13.4 | 11.5 | 9.9 |
| count | 12 | 13 | 13 | 13 | 13 | 12 | 13 | 12 | 14 | 13 | 13 | 12 |
| sd | 1.00 | 1.21 | 1.07 | 1.02 | 0.89 | 0.84 | 0.96 | 1.16 | 0.88 | 0.77 | 0.82 | 0.92 |
Source: IOS Proudman Laboratory, Cefas (from 2010)